DebuggingProgramCrash
Available languages: Italiano,
This page is part of the debugging series — pages with debugging details for a variety of Ubuntu packages. |
This document describes how to debug Ubuntu package crashes and install debug packages on Ubuntu, which will aid in providing information for bugs.
Using apport-retrace
If you want to debug a crash in packaged Ubuntu software, Apport will usually pick it up, create a .crash report in /var/crash/ and report the crashed program. From there it is easiest to use apport-retrace.
apport-retrace regenerates the stack traces (both the simple and the threaded one) from an apport crash report from the included core dump, or gives you a Terminal window with gdb in an environment with debugging symbols, reproducing the situation of the crash through the core dump. For this it figures out the set of necessary packages and their accompanying debug symbol packages, so that the regenerated stack trace will be fully symbolic and thus become much more useful for developers to fix the problem.
apport-retrace has two modes: By default it will just regenerate traces based on the packages which are currently installed in the system, i. e. it assumes that all necessary debug symbols for the report are installed (see the next paragraph for this). When specifying the -S option, it creates a temporary "sandbox" and downloads and installs all necessary packages and debug symbols there. It will not do any changes to your system and does not require any special privileges.
Please see the apport-retrace manpage for details and some examples how to run it.
You can also invoke this directly from the Apport crash notification, by clicking the "Examine locally" button:
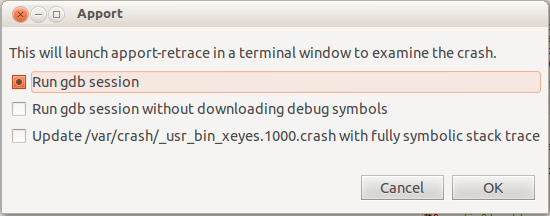
This will collect some package information and then ask you in which mode you want to run apport-retrace:
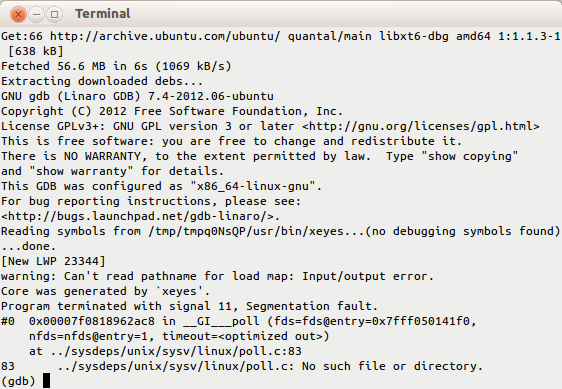
Normally you want to keep the first option, which will get you in a gdb session in the sandbox:
If you do not want an interactive gdb session but just want it to update the already existing .crash file with fully symbolic stack traces, you can select the third option.
Debug Symbol Packages
If you want to debug a crash in a project you are developing yourself or from a third-party package, or need the debug symbols for particular libraries very often, it is helpful to install those permanently into your system.
First, check if there is a package with a -dbg suffix in the main Ubuntu repositories. These are the debug symbol packages, and are equivalent to '-dbgsym' described below. You can safely use either one, but not both at once. Try installing the package, adding -dbg to its name, for example:
sudo apt-get install xserver-xorg-core-dbg
if the package in question is the xserver-xorg-core package.
If there is no -dbg package:
Create an /etc/apt/sources.list.d/ddebs.list by running the following line at a terminal:
echo "deb http://ddebs.ubuntu.com $(lsb_release -cs) main restricted universe multiverse" | \
sudo tee -a /etc/apt/sources.list.d/ddebs.list
- Stable releases (not alphas and betas) require three more lines adding to the same file, which is done by the following terminal command:
echo "deb http://ddebs.ubuntu.com $(lsb_release -cs) main restricted universe multiverse
deb http://ddebs.ubuntu.com $(lsb_release -cs)-updates main restricted universe multiverse
deb http://ddebs.ubuntu.com $(lsb_release -cs)-security main restricted universe multiverse
deb http://ddebs.ubuntu.com $(lsb_release -cs)-proposed main restricted universe multiverse" | \
sudo tee -a /etc/apt/sources.list.d/ddebs.list
You may also add these lines using the Synaptic Package Manager:Choose Synaptic via the System > Administration menu.
Choose Software Sources or Repositories via the Settings menu, and click on the Third-Party Software tab.
Click the Add button and enter each deb ... line as above one by one and click the Add Source button (you will have to add these lines one at a time).
- Import the debug symbol archive signing key:
sudo apt-key adv --keyserver keyserver.ubuntu.com --recv-keys 428D7C01
- Then run
sudo apt-get update
to update your package list or click the Reload button if you used the Synaptic Package Manager.
- The debug symbol packages have the '-dbgsym' suffix attached, so to install the debug symbols for the package 'yelp', you first run:
apt-cache policy yelp
This will show you the version number currently installed (we'll use 2.22.1-0ubuntu2.8.04.1 in this example).NOTE: 'yelp' [which is the package name of "Help and Support" located under the 'System' menu] is just an example and not a part of the command: 'yelp' is only used to demonstrate the procedure. You must replace 'yelp' with the name of the package you want to debug.
- Install the debug symbols:
sudo apt-get install yelp-dbgsym=2.22.1-0ubuntu2.8.04.1
You can also use the Synaptic Package Manager to search for 'yelp-dbgsym' and install it from there.
The above procedure will install the debug symbol package for yelp only. Chances are that yelp uses shared libraries in other packages and debug symbols for them might be required in order to obtain a readable stack trace. You can download the list-symbols-packages-v2.sh shell script and run it (after a chmod a+x list-symbols-packages-v2.sh) this way:
![]() we updated list-dbgsym-packages-v2.sh to list-symbols-packages-v2.sh. This is the first change to make it compatible with newer GDB (which does not, by default, load all libraries at start anymore). -v2 is currently only working if you run it against a currently-executing binary (i.e., with '-p $(pidof <whatever>').
we updated list-dbgsym-packages-v2.sh to list-symbols-packages-v2.sh. This is the first change to make it compatible with newer GDB (which does not, by default, load all libraries at start anymore). -v2 is currently only working if you run it against a currently-executing binary (i.e., with '-p $(pidof <whatever>').
bash list-symbols-packages-v2.sh yelp
in order to obtain a more complete list of symbol packages to install. The script may also attach to a running process and in this case it gives an even more complete list of symbol packages to install, and this is recommended if the problem you are having does not prevent you from running the program. You can usually get the process ID of a running process using <code>pidof</code>, so while you have yelp running you might run:
bash list-symbols-packages-v2.sh -p $(pidof -s yelp)
to get a list of packages that should be installed for best debug information. If the running process is a server (daemon), you might have to run 'list-symbols-packages.sh' with sudo.
Now you make a Backtrace.
You can also run Valgrind, if the program crashes with a "Segmentation fault" or "Bus error".
Optionally, you may be asked to produce an Strace.
You can also provide this file : ~/.xsession-errors
How do we remove all this stuff after getting the trace and get back to a normal system?
You can remove all debug symbol packages and the ddebs repositories with the following commands:
sudo apt-get remove \.*-dbgsym
sudo rm /etc/apt/sources.list.d/ddebs.list
sudo apt-get update
References
The Xorg server
The X server will by default trap its own crashes and dump a stack trace in /var/log/Xorg.0.log. However, this stack trace is modified by the signal handler itself. To get a "normal" crash, which will trigger a core dump (and apport reporting), add this to your /etc/X11/xorg.conf:
Section "ServerFlags"
        Option "NoTrapSignals" "true"
EndSection
Please see X/Debugging for how to debug Xorg server crashes.
Info for the BugSquad
If you're trying to apport-retrace a crash report from a bug that didn't happen on the same Ubuntu release as the one you're running, do the following:
Say that you're running Gutsy and the crash happened on Feisty:
This will create a minimal feisty system.
sudo mkdir -p /chroots/feisty
sudo debootstrap feisty /chroots/feisty/
Now you change into this minimal feisty system.
sudo chroot /chroots/feisty
edit /etc/apt/sources/list and all the repositories you need, especially Martin's ddeb repository.
apt-get update; apt-get install gdb apport
use apport-retrace as you're used to.
For more information on dealing with bug reports Apport see Bugs/ApportRetraces.


